Introduction: Turning Data into Action in the Ready-Mix Industry
In today’s fast-paced construction sector, ready-mix concrete producers must make rapid, informed decisions to stay competitive. With operations involving batching plants, fleets, raw materials, delivery schedules, sales forecasting, and customer satisfaction, tracking performance manually is no longer sustainable.
Modern ERP systems integrated with Business Intelligence (BI) and real-time dashboards allow plant managers, operations heads, and executive leadership to visualize performance across every function of the business. With this level of visibility, teams can anticipate problems, optimize workflows, improve margins, and confidently make decisions backed by data.
Real-Time Dashboards for Plant Performance
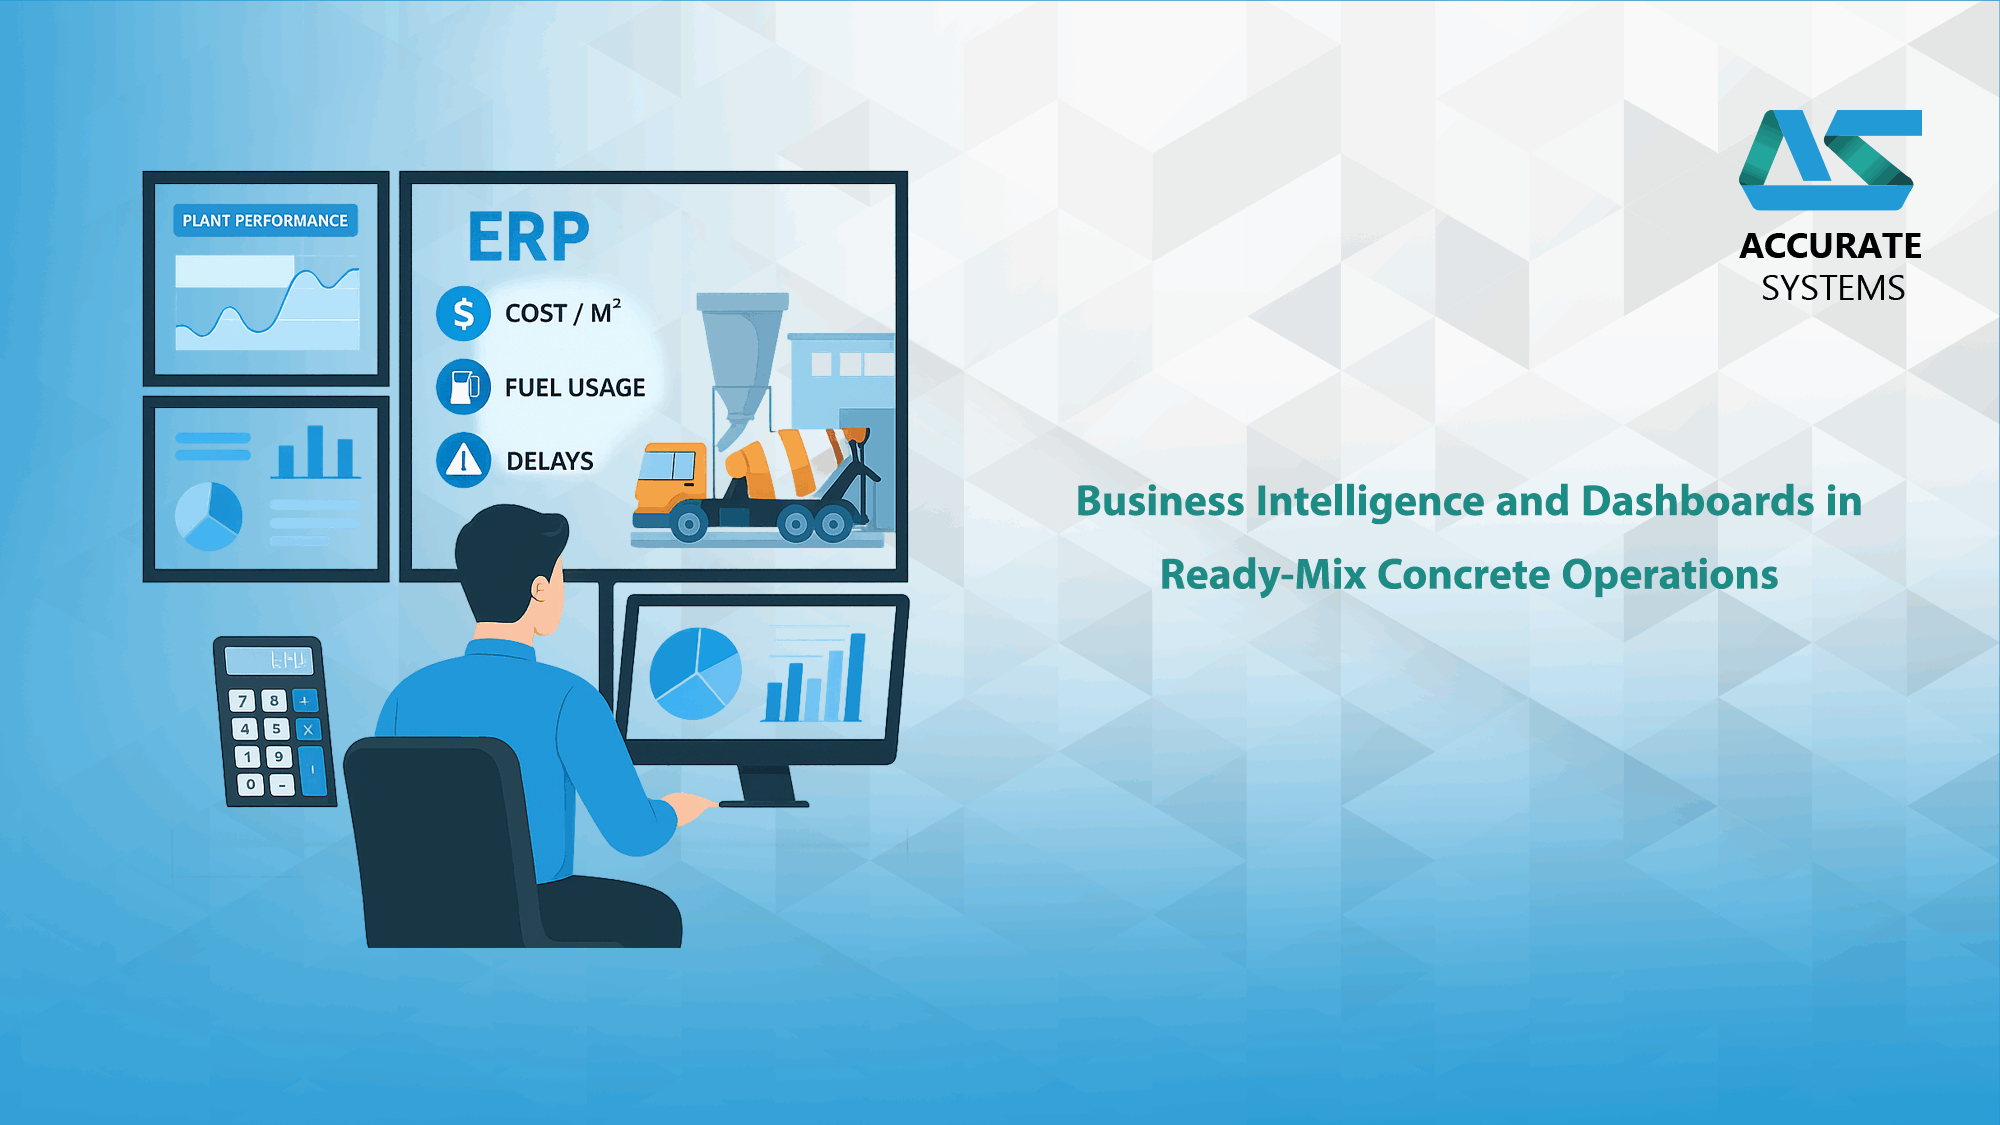
Dashboards are the digital control tower for production, logistics, and financial operations. In a ready-mix ERP system, dashboards centralize and visualize live data from sales orders, production logs, dispatch operations, and financial transactions.
Core Dashboard Categories:
- Plant Output Overview: Displays cubic meters produced per shift, per plant, or per mix design.
- Batch Accuracy Monitoring: Compares target vs. actual weights of cement, aggregates, water, and admixtures per batch.
- Fleet & Delivery Status: Shows truck locations, estimated time of arrival (ETA), idle time, and total trip count.
- Customer Order Tracking: Real-time overview of open orders, fulfillment progress, and customer-specific SLAs.
- Material Inventory Levels: Monitors usage and remaining stocks for key inputs like cement, sand, gravel, and additives.
- Downtime Logs: Track unplanned outages or underperformance of silos, mixers, or loading equipment.
Benefits:
- Enable live monitoring of daily operations from plant floor to management office
- Identify production delays, fleet inefficiencies, or mix deviations early
- Empower cross-department teams with shared operational visibility
Key Metrics: Cost per Cubic Meter, Fuel Usage, Delays, and More
Business Intelligence systems are only as effective as the KPIs they track. In the ready-mix context, the following metrics help leaders control costs, optimize logistics, and maintain consistency in product and service quality.
Key Operational KPIs:
- Cost per Cubic Meter Delivered: Calculates true production and delivery cost including fuel, maintenance, material, labor, and overhead.
- Fuel Efficiency (L/km or L/trip): Measure fuel usage by truck, trip distance, or project.
- Fleet Utilization Rate: % of total truck capacity in use over a given period.
- Mix Accuracy Deviation (%): Highlight batches with over/under dosage of key ingredients.
- Production Throughput: Cubic meters produced per hour or shift.
- Delivery Performance: On-time delivery %, delay causes, and average deviation from promised delivery window.
Financial, Compliance, and Strategic KPIs:
- Revenue per Plant/Region: Break down total sales geographically or by operational unit.
- Client-Specific Profitability: Show margin levels per key client or contract.
- ZATCA Compliance Score: Ratio of properly cleared e-invoices to total issued.
- AR Aging Dashboard: Track unpaid invoices by customer and days overdue.
- Raw Material Forecasting Accuracy: Compare forecasted vs. actual consumption by product or mix type.
Benefits:
- Increase cost transparency across operations
- Track waste and inefficiencies with precision
- Enable KPI-driven performance appraisals and incentives
Supporting Executive Decisions Through Data
For directors and business owners, BI dashboards transform raw data into strategic insight. Instead of static reports, leaders can explore live dashboards that consolidate finance, operations, logistics, and customer analytics into one interface.
Executive Dashboard Capabilities:
- Revenue & Margin Trends: Visualize month-on-month changes and gross margin fluctuations.
- Scenario Planning Tools: Model how fuel price increases, plant downtime, or sales discounts will affect profitability.
- Forecasting & Budget Tracking: Compare actual financials vs. forecasts to inform spending and investment.
- KPI Benchmarking Across Sites: Compare performance across different plants, shifts, or teams.
- Client Loyalty & Churn Analysis: Identify recurring clients vs. one-time orders and correlate with service metrics.
Benefits:
- Improve decision-making with forward-looking insights
- Align long-term strategy with plant-level execution
- Equip stakeholders with transparent, visual data to reduce uncertainty
Advanced BI Capabilities in Modern ERP Platforms
In addition to visual dashboards, advanced ERP-integrated BI systems offer:
- Drill-Down Reporting: Click from a dashboard metric into the underlying data (e.g., from “Fuel Cost” to driver-level fuel logs).
- Custom Reports: Build tailored reports for regulatory bodies, investors, or internal audits.
- Mobile BI: Access dashboards from tablets and smartphones for field-level visibility.
- Alerting & Notifications: Configure threshold-based alerts (e.g., low inventory, delivery delay, KPI dips).
- Data Export for BI Tools: Connect with Power BI, Tableau, or Excel for further analysis.
Conclusion: BI as the Competitive Edge for Ready-Mix Producers
In the ready-mix concrete industry, where margins are tight and timelines critical, Business Intelligence is no longer optional—it is a strategic necessity. ERP-integrated dashboards empower plant operators, logistics managers, finance teams, and executives with the data they need to make informed, rapid, and aligned decisions.
With the right KPIs, visual tools, and real-time visibility, ready-mix companies can reduce waste, improve service, and grow profitably in a highly demanding market.
#ReadyMixConcrete #ERPNext #BusinessIntelligence #ConcreteERP #RealTimeDashboards #BatchingPlantKPIs #SmartConstruction #FleetEfficiency #BIforConstruction #DataDrivenDecisions


Leave A Comment